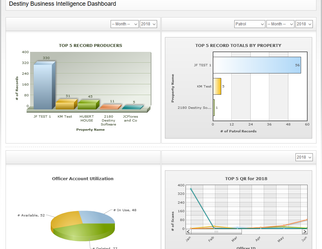
The Business Intelligence module can be used to create a variety of different reports and graphs based on the reports that your users have created. The reports that you create can be downloaded and emailed to other in either PDF or CSV formats.
When you access Business Intelligence you are greeted by four graphs that provide, as you will see below offer useful information properties that produce the most reports and well as users that produce the most reports.
How to create graphs
The following video will explain how "Charts" are created
How to create a custom report
The following video will explain how a custom report is created
