/
How To - Use Business Intelligence
How To - Use Business Intelligence
- John Flores
- Daniel Esparza
Owned by John Flores
Last updated: Jul 18, 2018 by Daniel Esparza
The Business Intelligence module can be used to create a variety of different reports and graphs based on the reports that your users have created. The reports that you create can be downloaded and emailed to others in either PDF or CSV formats.
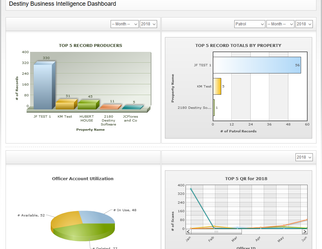
When you access Business Intelligence you are greeted by four graphs that provide useful information on accounts and users that produce the most reports.
How to create graphs
- From the Business Intelligence main page click on "Charts" on the top toolbar.
- On the left select the type of chart you want to create
- Apply the filters that allow you to create the chart you need. Some of the filters are the account, user, date, and year
- Once you have selected the appropriate filters, click on the "View" button to view the requested chart
How to create a report
- From the Business Intelligence main page, click on "Reports" on the top toolbar.
- Select the report type for the report you wish to create, click "Next"
- Depending on the report type, various filters will be displayed, such as classification for a report created using Incident Reports
- Select the appropriate filter for your report. If you wish to include all options, leave the filters blank. Click the "Next" button to move to the next option
When your report is ready another page will prompt you "Your report results are ready to view", click "View Results"
- On the results screen, you will find the number of reports that comprise your report, links so that you can view each report, and export options. Please note, due to the number of attachments, some of the reports that the system creates will only allow 150 records per download. Changing of the date range can be used to break-up larger reports.
How to use Op. Reports (Operational Reports)
- From the Business Intelligence main page click on "Op. Reports" on the top toolbar.
- When the page opens you will be greeted by several useful report types
- Select the report that best fits your needs, select the filters then click "View"
, multiple selections available,
Related content
New Feature: Admin Portal Business Intelligence (2022)
New Feature: Admin Portal Business Intelligence (2022)
More like this
Creating Summary Reports
Creating Summary Reports
More like this
Reports: Years of Service
Reports: Years of Service
More like this
How to enable and create Custom Reports
How to enable and create Custom Reports
More like this
Human Resources: Reports
Human Resources: Reports
More like this
Reports: Job History
Reports: Job History
More like this